numbers, not adjectives — D. J. C. MacKay
8 When will we reach long term average +1.5°C?
Carl Edward Rasmussen, February 6, 2026
Long term1 average +1.5°C will be reached in January 2034 ± 16 months (95% confidence).
The signatories to the Paris Agreement have agreed to “pursuing efforts to limit the temperature increase to 1.5°C above pre-industrial levels”, but will this goal likely be met, and if not, when will the +1.5°C limit be reached? To answer this question, I’ll briefly look at the relationship between temperature and CO2 in the atmosphere, then examine the growth rate of atmospheric CO2, and finally analyse the mechanisms adopted by the Paris Agreement to assess their practical effectiveness. There will be no need to employ sophisticated climate models, straight forward examination of the relevant data will suffice.
8.1 Correlation between CO2 and temperature
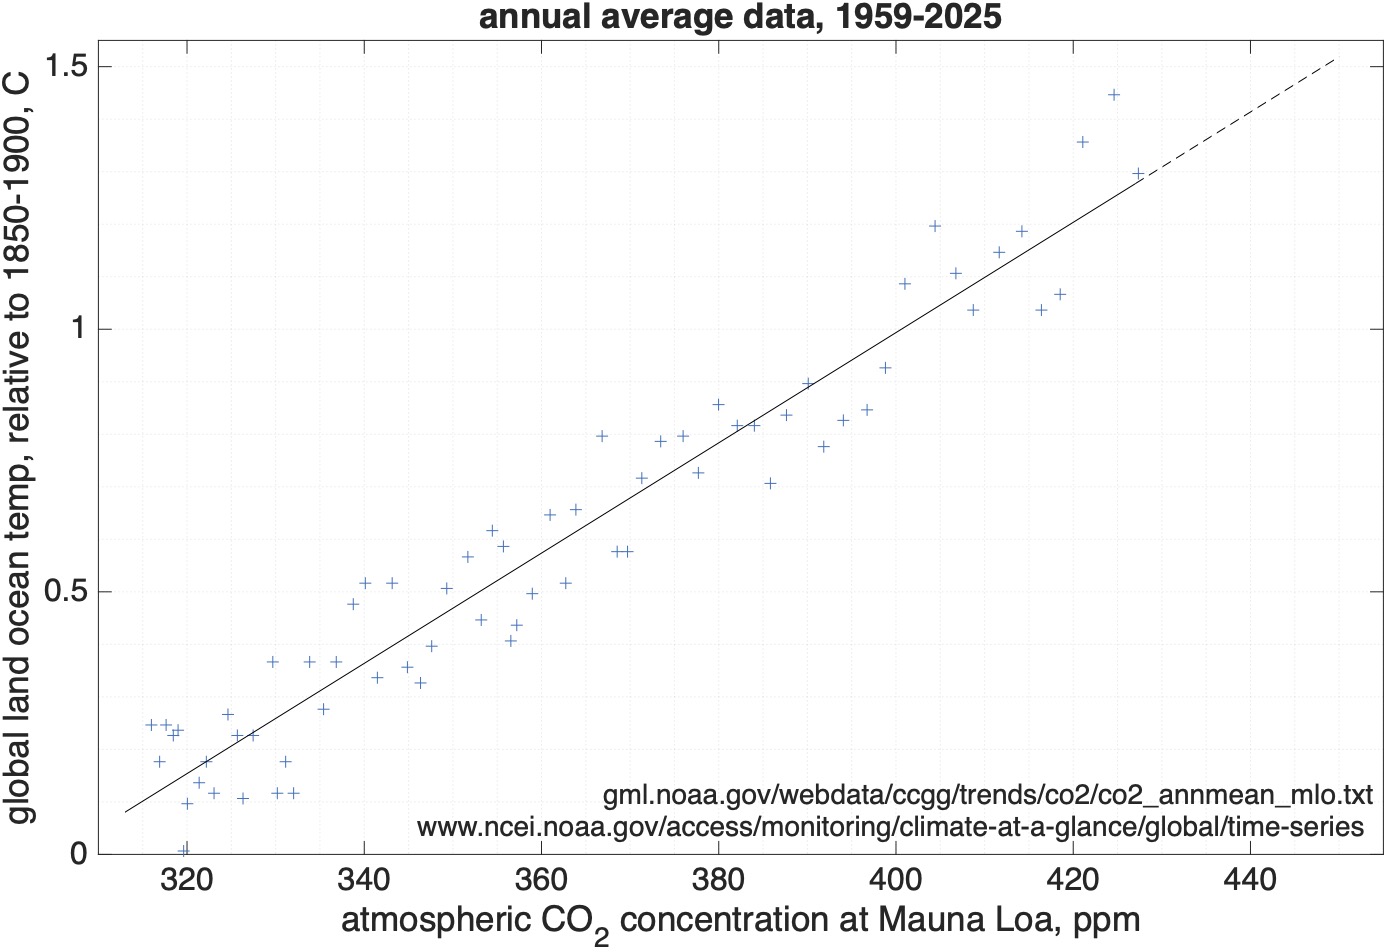
Emission of greenhouse gases, caused primarily by our use of fossil fuels, is causing global warming. But how much warming is caused by how much CO2? Below I plot temperature as a function of the atmospheric concentration of CO2 in a scatter plot:

We use the scatter plot to empirically test the strength of the relationship within the 67 years of CO2 measurements at Mauna Loa. The strength of this relationship is remarkable. The discrepancies between a straight line2 superimposed on the graph to the measurements have a standard deviation of less than 0.1°C. There is no intrinsic reason to think that the relationship should necessarily be very tight. For example, CO2 is just one of several greenhouse gases (methane is another). Other compounds such as aerosols also have an effect on temperature. And we expect the effect of greenhouse gases to take time to manifest itself. Finally, temperature is affected by other processes, such as El Niño and La Liña events. Nevertheless, empirically we find that these effects, over the 67 year time period considered, only manifest themselves weakly or more or less seem to average out, leaving a close to straight line relationship between CO2 concentration and temperature anomaly.
Regardless of the possible existence of other effects on temperature than CO2, it’s not unreasonable in the light of the very tight relationship over the past 67 years, to assume that similar tendencies will persist in the near future. A modest extrapolation of the line in the plot, by the dashed line, shows that +1.5°C will likely be reached when the CO2 level reaches 450 ppm.
8.2 Atmospheric CO2 concentration through time
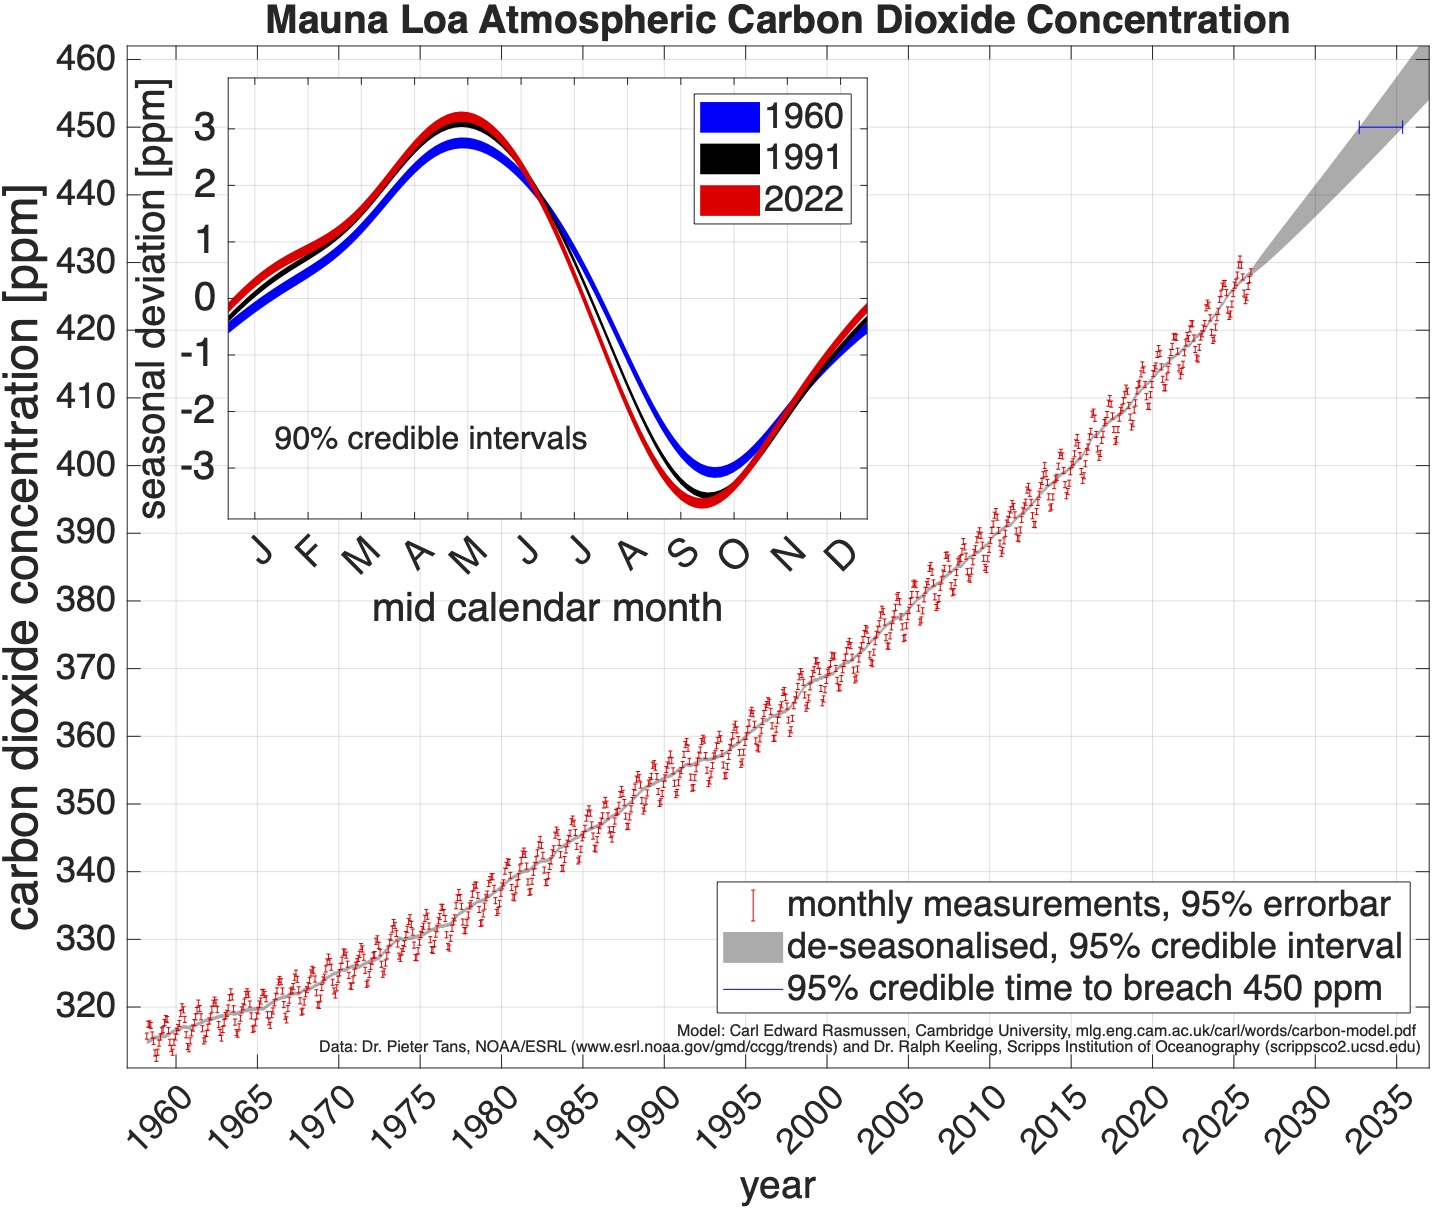
So, when will we reach 450 ppm atmospheric CO2? Below I plot the monthly CO2 concentration against time, for the past 67 years:

We see a pronounced seasonal variability, and an accelerating upward trend. As well as the observations in red, I’ve also plotted a de-seasonalised curve in grey, whose thickness represents the 95% credible interval (see model details). Note that the line becomes wider the further into the future we predict, reflecting increased uncertainty. The predictions cross the 450 ppm concentration as indicated by the small blue segment on the plot. The time is centred on December 20343, and the 95% credible interval extends ± 16 months on either side.
8.3 Discussion
You may wonder, whether the predictions above adequately take account of recent developments which may influence climate change. These include the political process behind the Paris Agreement, the technological advances such as electric cars and the improved economics of renewable energy sources such as solar and wind. Let’s examine these. The Paris Agreement has so far failed to deliver. Many promises have been made, but the temperature doesn’t depend on promises, but on greenhouse gas concentrations. So, let’s look at the graph above: has the CO2 growth rate changed significantly since the Paris Agreement entered into force in 2016? Sadly, no. The Paris Agreement is weak, with no binding emission limits and no tangible route to achieve them. We would need a much stronger agreement to be effective. What about new technologies, and cheaper renewables? It’s true that there is growth in the number of electric vehicles, and the capacity of renewables. But that is not the relevant point. The relevant question is: does the added renewables capacity exceed the increase in demand, by growth in global energy requirements from rising prosperity and population growth, and will renewables at scale prevail against politically and economically powerful fossil fuel interests? I don’t see any convincing evidence that this is happening. And therefore similar behaviour of atmospheric carbon dioxide evolution is to be expected in the near future. And our reasoning, leading to a likely early 2034 breach of +1.5°C, stands.
I’m surprised that so many people insist that it is still possible to avoid +1.5°C. It may be possible in the same sense that it is possible for me to walk from Amsterdam to Beijing. As in not a verifiable physical impossibility. But it’s not going to happen. So, why is it relevant to insist? Perhaps, some are confusing hope with reality. I certainly hope that we won’t reach +1.5°C, but that doesn’t change reality. I think it is delusional without a radically different approach — and there is no sign of that happening. My text isn’t supposed to intimidate or alarm, on the contrary to enlighten. Surely, the first step of solving a problem, is to understand its nature.
8.4 CO2 model details
If you’re unfamiliar with statistical models, you probably want to skip this section. The objective is to build a model of CO2 concentration \(c\) as a function of time \(t\). The non-parametric Bayesian model is based on a prior Gaussian process (Rasmussen and Williams 2006): \[ c\;∼\;{\cal N}(μ,\; k_\mathrm{trend} + k_\mathrm{season} + k_\mathrm{noise}), \] which means: the function \(c\) is distributed according to a Gaussian process with mean function \(μ\) and covariance function which is a sum of three components: the trend \(k_\mathrm{trend}\), the seasonal part \(k_\mathrm{season}\) and the noise \(k_\mathrm{noise}\).
The prior mean function is constant \[ μ(t)\;=\;280 \mathrm{\ ppm}, \] with a value equaling the preindustrial CO2 concentration. The trend covariance in the sum of three types of random walk: \[ k_\mathrm{trend}(t,t')\;=\;\sigma^2_\mathrm{B}k_\mathrm{Brown}(t,t')+\sigma^2_2k_\mathrm{2IW}(t,t')+\sigma^2_3k_\mathrm{3IW}(t,t'), \] where \(k_\mathrm{Brown}\) is the covariance of Brownian motion (equivalent to integrated white noise), \(k_\mathrm{2IW}\) is the covariance of twice integrated white noise and \(k_\mathrm{3IW}\) is the covariance of 3 times integrated white noise. Each random walk is anchored at zero in 1750, ie at the end of pre-industrial times. The seasonal component is locally periodic: \[ k_\mathrm{season}(t,t')\;=\;\sigma_s^2k_\mathrm{periodic}(t,t')\,k_\mathrm{Gauss}(t,t') \] where the smooth unit periodic component has covariance: \[ k_\mathrm{periodic}(t,t')\;=\;\frac{\exp(-\frac{2\sin^2(\pi(t-t'))}{\ell^2})-\alpha}{1-\alpha},\quad \alpha\;=\;\int_0^\pi\!\!\exp(-\frac{2\sin^2(r)}{\ell^2})dr, \] and the localness is determined by: \[ k_\mathrm{Gauss}(t,t')\;=\;\exp(-\frac{(t-t')^2}{2\lambda^2}). \] Finally the noise covariance is: \[ k_\mathrm{noise}(t,t')\;=\;\sigma_n^2k_\mathrm{white}(t,t')+\sigma_c^2k_\mathrm{Gauss}(t,t'). \] The model is fit my maximum (marginal) likelihood wrt the hyperparameters. More mathematical details.
Global average temperature fluctuates year on year. By “reaching +1.5°C” I specifically mean the long term smoothed temperature, ignoring short term fluctuations. This is presumably the meaning intended in the Paris Agreement (although it doesn’t specify). It is likely that the threshold will be reached in single years before 2033, as well as dipping back under the threshold in single years after 2033.↩︎
If, as is commonly done, temperature is plotted as a function time (instead of CO2 concentration) you won’t get a straight line, because the rate of increase of CO2 has been changing. A plot which reflects the causal mechanism, rising CO2 causes rising temperature, gives a close to straight line relationship (in the 67 year time frame considered here).↩︎
The IPCC in their AR6 report from 2023 reach essentially identical conclusions using climate models: they expect the 20-year average global temperature to exceed +1.5°C in the early 2030s.↩︎